Grafana
Grafana allows you to query, visualize, alert on and understand your metrics no matter where they are stored. Create, explore, and share beautiful dashboards with your team and foster a data driven culture.
Grafana can be enabled on the marketplace dashboard in any account.
Grafana is an Organization wide integration. This means if you enable Grafana in a 2nd project, you won't be charged for additional licenses. It also means you can see all projects when logged into your Organization's Grafana.
Adding additional users
You can add additional users to Grafana from the Gigapipe UI here: https://forms.gle/x31Hyc6ARGSWMaMAA
Please note you cannot manually add users to Grafana within Grafana, please always add users using the 'add user' feature within Gigapipe.
Users may only be added to your Grafana account if they are already members of your Organization AND your Project in Gigapipe.
Dashboards
You can create your own dashboards in Grafana or import ready made dashboards. We'll be adding more pre-made dashboard templates over time. If you have any requests for dashboards, please let us know!
Available connections
Integration in the Gigapipe ecostystem can be automatically integrated to eachother. Here is a list of the integrations available with Grafana:
| Integration | Auto-action |
|---|---|
| ClickHouse | Add ClickHouse datasource |
| qryn cloud | Add qryn Loki, Tempo & Prometheus datasources |
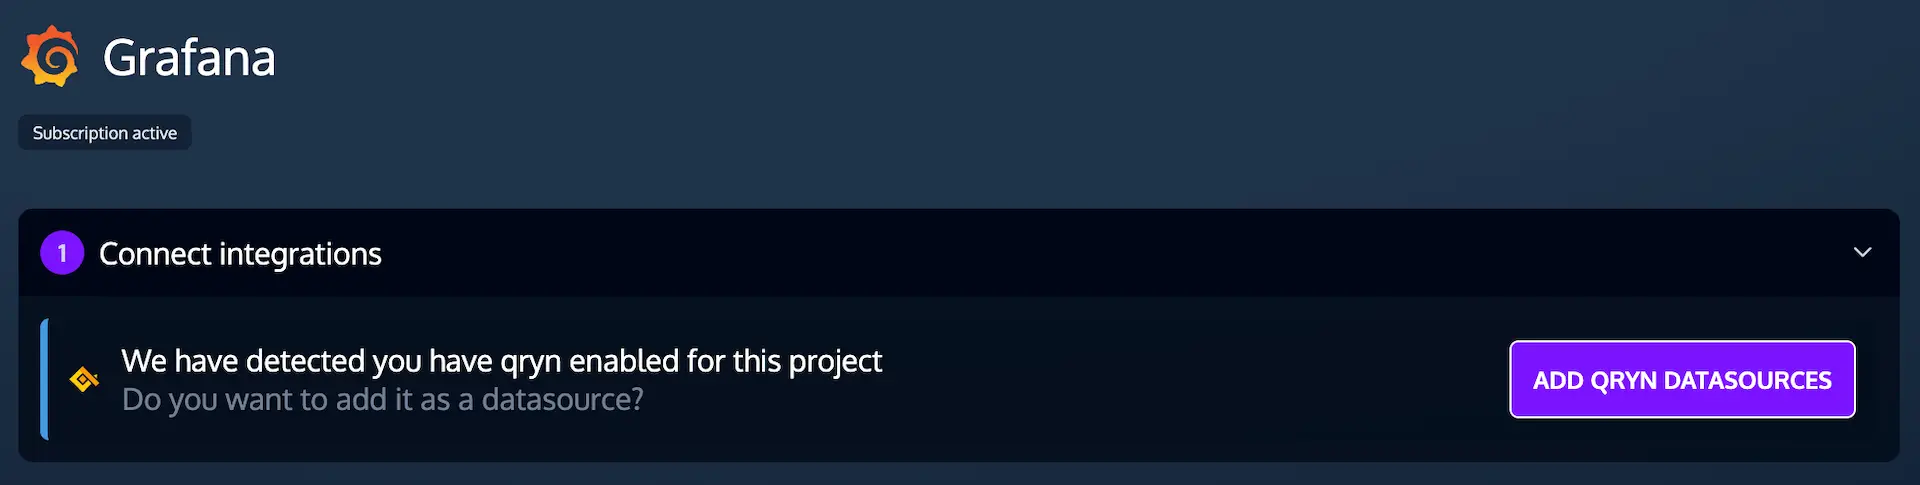
qryn cloud datasources
Adding the qryn datasources directly from the Grafana page will add qryn Loki (for logs), qryn Tempo (for traces), and qryn Prometheus (for metrics) as individual data sources to Grafana. If you enable qryn and Grafana on a separate project, you may also add these data sources and they will appear in the same Grafana account.